PERSPECTIVES
MARKET AND ALLOCATION
Our experts monthly overview
OUR CENTRAL SCENARIO

Deputy Chief Executive Officer,
Chief Investment Officer
OFI INVEST
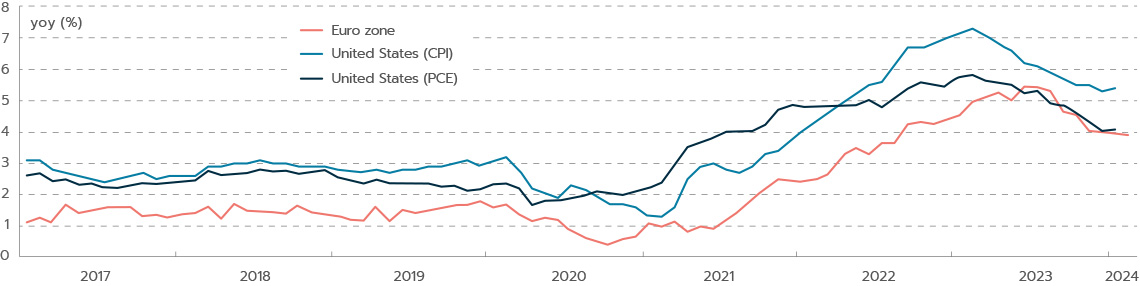
Total inflation continued to recede on both sides of the Atlantic, as central banks had expected, but core inflation is still taking time to return to their target. Central banks stressed this latter point, indicating that they are willing to wait before lowering their key rates later his year. Market expectations are now in line with the projections we made early this year, i.e., three or four rate cuts this year, with the first one coming by this summer.
Bond yields adjusted accordingly, to 4.30% in the US and 2.50% in Germany, levels at which we are moving to a slightly positive stance on the asset class. We believe that slightly higher duration in portfolios is a good place to be in the current environment of a slowing US economy and a still highly uncertain geopolitical environment. Stubbornly high service prices could push back expectations on short-term rate cuts or even actual central banks’ actual timetable. This could push bond yields up further, which at that point, could be opportunities to expand exposure.
Credit markets continued to perform well and were impacted only by their interest-rate component. We still expect this asset class to preform close to its current carry levels, with enhanced protection from the recent increase in yields. The effects of past monetary tightening will continue to generate idiosyncratic risks on the shakiest companies, and bond-picking will remain decisive, in particular on the high-yield credit market.
Equity markets rose further, driven by the same forces as in January (tech, artificial intelligence, and luxury goods, in particular) and are also still polarised between a few giga-caps and everyone else, in both Europe and the US. These stocks have flying above the cycle and, for the moment, rising interest rates. The markets’ bullishness cannot be ignored, despite real risks from the geopolitical context, the US economic slowdown, and stubborn inflation. We therefore reiterate our neutral stance on the equity markets, pending bouts of volatility or market excesses that could be put to use in modifying exposures.
OUR VIEWS AS OF 06/03/2024


The markets have lowered their rate-cut expectations, which are now line with our projections. They are now pricing in three to four rate cuts by the US Federal Reserve and the European Central Bank for 2024 with the first one coming in June. The 10-year German yield rose from 2.16% to 2.41% in February, above levels that, in our view, justify overweighting fixed income. We could raise this weighting if yields were to continue rising. Amidst a persistently buoyant economic context, we also reiterate our positive view of both investment grade and high yield. And the money market, with yields still close to 4%, still looks attractive.


Bond yields rose slightly on both sides of the Atlantic, while 2024 earnings forecasts were lowered. That caused priceearnings (P/E) ratios to rise and the risk premium to decline. The markets have more or less achieved our expected gains for the entire year, and that’s why we are sticking to our neutral stance on the asset class. Valuations are still in line with their historical average in Europe but have surpassed them by far in the US. Even so, the big AI-driven tech stocks just keep surprising us and suggest that their profits may be underestimated. We are therefore refraining from expressing a preference between the various geographical regions. Our one-notch upgrade of China paid off after that market took off in February. It could continue to move up in the short term before we decide to downgrade our outlook for structural reasons.
The euro was almost unchanged to the dollar in February. The dollar’s rally ran out of steam from the very first signs of a slight slowdown in the US economy in the first quarter. With disinflation still on track in the US and activity gradually recovering in the euro zone, we don’t expect the dollar rally to continue. We remain constructive on the yen, keeping in mind that Japanese monetary policy should continue to move back to normal, given the strength of domestic inflation at this stage.

MACROECONOMIC VIEW
THE PACE OF DISINFLATION LEAVES SOME ROOM FOR DOUBT

Head of Macroeconomic Research
and Strategy
OFI INVEST ASSET MANAGEMENT
As 2023 came to a close, the markets were excited by the steep drop in inflation and were pricing in key rate cuts by the Fed and ECB as early as March or April. However, the latest inflation figures dashed those expectations and served as a reminder that the home stretch of disinflation will be more gradual, as it covers the most stubborn components, services in particular. Statements by central bank governors have gradually reiterated the need for caution and patience before easing monetary policy. Over time, the markets have moderated their expectations are now more in line with our view that the Fed and ECB are unlikely to lower rates until this summer. One sign of the change in market expectations: in late February the US SOFR(1) market of options on futures was pricing in a 5-10% probability of Fed rate hikes this year!
IS A NEW ABOUT-FACE BY CENTRAL BANKS BELIEVABLE?
First of all, PMI business surveys suggest that supplier delivery times fell in February, after rising in January due to transport disruptions in the Red Sea. This improvement relieved some pricing pressure in the manufacturing sector. This came on top of Chinese deflation, which is helping to contain risk on a global scale.
There are still some concerns over the labour-intensive service sector, where momentum has stabilised on the whole in the euro zone while picking up slightly in the US.
More in detail, US inflation pulled back from 3.4% to 3.2% year-onyear in January, while the personal expenditure deflator (the Fed’s favourite benchmark) fell below 2.5%, to 2.4% in January after 2.6% in December. It is core inflation in both indices (i.e., without volatile components) that remains higher, respectively at 3.9% and 2.8%. Housing prices are hardly slowing down, while transport services (particularly auto repairs and insurance) and healthcare have accelerated. Not until next month will we see whether this acceleration is due to one-off seasonal factors (i.e., the fact that price hikes are more frequent early in the year) or is the start of a more worrisome trend for the Fed, linked to the resilience of growth and the job market.
Weaker household consumption in January and lower consumer optimism regarding the job market suggest that job market pressures should continue to ease, as should wages, which would relieve pressure on future prices. If so, early-year numbers will make some noise, but noise that should, in any case, cause the Fed to be prudent and patient. At its March meeting, the Fed will also discuss the future of its current process of quantitative tightening (i.e., shrinking its balance sheet by refraining from reinvesting proceeds from maturing bonds). The Fed could soon announce a deceleration of quantitative tightening around mid-year. Keep in mind that the normalisation of the Fed’s balance sheet has so far had little impact on the bond markets.
AN EYE BEING KEPT ON INFLATION IN SERVICES
In the euro zone, total inflation receded to 2.6%, while core inflation remains above 3.0% (3.1%) and services inflation is still very close to 4.0% (at 3.9%). These figures would seem to rule out a premature cut in key rates, given that European wages were still rising at a 4.5% pace at the end of 2023 and even more than 5.0% when including one-off payments, such as bonuses, overtime, etc. Moreover, many collective wage bargaining rounds are scheduled for February and March; the ECB could therefore wait for first-quarter data to confirm the slowdown in wages, data that won’t be available until May, before pulling the trigger on an initial rate cut.
In short, caution is in order on inflation, but at this point the disinflation process looks safe, barring risks that could arise from other, geopolitical or political events, such as the US presidential election.
INTEREST RATES
RATE CUTS CAN WAIT

Co-CIO, Mutual Funds
OFI INVEST ASSET MANAGEMENT
In February, the markets moved into line with our own key-rate expectations. At month-end, Fed Funds futures were pricing in just three rate cuts in the US this year, with the first one perhaps in June. The same for Europe. While key rates can wait till June, there is less and less uncertainty on whether the ECB could cut rates before the US Federal Reserve does. The ECB has never before cut its rates before the Fed, but growth and inflation are more solid in the US than in Europe. ECB members have tried to downplay this scenario. For example, Robert Holzmann, a member of the ECB Governing Council, said “My conjecture is to say we won’t move before June in any case, but also not before the Fed”. Macroeconomic data in the coming months will provide more insight. Keep an eye in particular on US growth and European wage inflation.
With this shift in expectations, bond yields continued to move up, with the 10-year Bund rising from 2.16% to 2.41% on the month. We feel this level justifies a slight overweighting that could be expanded if this yield rises any further in the coming weeks.
KEEP BETTING ON CARRY
In addition to government bonds, we are overweighting all fixed-income asset classes, and each of them for different or complementary reasons.
The money market, with the €ster yield still close to 3.90%, offers, in our view, an attractive level with few risks. This is likely to last at least until the first ECB rate cut. Moreover, based on current expectations, the 2024 yield on money-market funds could even surpass its 2023 level (3.28% in the case of the €ster capitalised).
Investment grade bonds, meanwhile, have given up -0.75% on the year to date (based on the Bloomberg Barclays Capital Euro Aggregate Corporate index, with net coupons reinvested) but this is due mainly to higher interest rates, as credit market conditions remain favourable, with spreads that continue to narrow, such as the Markit iTraxx Europe Crossover, which hit a two-year low in February, at 300, but a level that is still close to its longer-term historical average.
It is still far from its 2020 lows (close to 200). We expect these bonds to offer carry of almost 4% on a 6-12-month timeframe or even more if rates do fall.
High yield bonds, which are riskier, continued to outperform other fixed-income asset classes, gaining 1.39% on the year to date in the case of the Bloomberg Barclays Pan European High Yield in euros. High yield is being driven up by shorter duration and a tightening in credit spreads. Carry is higher there than in investment grade bonds, and short duration allows it to be more exposed to phases of rising long bond yields. In our baseline scenario, a targeted performance of about 7% 12 month out looks realistic, on the condition of selectiveness in issues. We still prefer BB rated issuers to B rated ones. Central banks’ management of key rates should help significantly cap the cost of corporate debt in the medium term and make us more confident in the solidity of European corporate issuers. However, keep an eye on the short-term risk of a widening in spreads.
This is where the Markit iTraxx Europe Crossover bottomed out in intraday trading on 23 February 2024.
| BOND INDICES WITH COUPONS REINVESTED | FEBRUARY 2024 | YTD |
|---|---|---|
| JPM Emu | - 1.15% | - 1.62% |
| Bloomberg Barclays Euro Aggregate Corp | - 0.88% | - 0.75% |
| Bloomberg Barclays Pan European High Yield in euro | 0.37% | 1.39% |
EQUITIES
SAME OLD STORY?…

Co-CIO, Mutual Funds
OFI INVEST ASSET MANAGEMENT
Equity markets began 2024 with a bang, flying over the effects of a slower pace of disinflation and higher bond yields during the period. This erased some of the effects of the retracing of bond yields in late 2023 without that affecting in the slightest appetite for the equity asset class. Rate-cut expectations are pulling back in the US, and there is now talk of just three rate cuts, with the first one coming in the second quarter at the earliest. Even more surprising is the fact that, whereas higher bond yields had over the past two years boosted the most value-oriented sectors and stocks, this time it was quality and growth stocks that performed strongly, driving indices upward.
BIG TECH IS LEADING THE DANCE IN THE US
In the US, big tech (Apple*, Amazon*, Alphabet*, Meta*, Microsoft* and Nvidia*) continue to lead the dance.
On the earnings front, these stocks, which now account for more than one quarter of US market cap, just keep raising their growth guidance. And expectations on their future prospects are almost scary. In the past five years, these happy few are expected to achieve annual revenue growth of 13%.
Net earnings are expected to rise by 17% on average each year, and free cash flow by 22%. In the fourth quarter 2023, these companies achieved almost 60% year-onyear growth in their earnings. That means that earnings by the other S&P 500 companies fell by 2% on average over the same period.
True, this is not the first time that American capitalism has produced companies with such robust growth potential. What is new, however, is that these companies are simultaneously able to fund huge investments in artificial intelligence AND to remunerate their shareholders from accumulated free cash flow, in the form of dividends and share buybacks. This is one reason these stocks are trading at a premium vs. the rest of the US market.
EUROPEAN CHAMPIONS ARE STANDING OUT
Europe also has its champions and euro zone market performances are just as unevenly spread as in the USs.
Year-to-date index gains are being driven by just a few growth stocks, including: ASML*, SAP*, Capgemini*, Adyen*, Ferrari*, Hermès*, and LVMH*. A lack of tech depth in the indices is thus being offset by a luxury sector that has returned somewhat to favour on the back of some solid earnings reports. Keep in mind also that these stocks generate lots of business outside Europe, which is probably no accident, given the prevailing economic sluggishness in Europe. Meanwhile, a few rate cuts would be welcome in restarting economic activity.
In Japan, the Nikkei at last set a new record. The previous record dated back to… 1989. There are probably no other markets in the world that have gone through such a lacklustre phase. All that’s left now is for the Topix to move above its all-time high, for the comeback story to be complete. These performances are no accident. Growth is indeed there, and Japanese companies achieved solid financial performances in the fourth quarter.
The Chinese market rallied at last, driven probably by the lunar new year and the rebound in consumer spending. Even so, PMI indices continue to point to slower manufacturing activity. In our view, firmer support from the central government is needed to keep this upward trend going.
The number of years it took for the Nikkei to return to its all-time highs.
| EQUITY INDICES WITH NET DIVIDENDS REINVESTED, IN LOCAL CURRENCIES | FEBRUARY 2024 | YTD |
|---|---|---|
| CAC 40 | 3.54% | 5.20% |
| EuroStoxx | 3.27% | 5.27% |
| S&P 500 in dollars | 5.29% | 7.03% |
| MSCI AC World in dollars | 4.29% | 4.90% |
* These companies are cited for information purposes only. This is neither an offer to sell nor a solicitation to buy securities.
EMERGING MARKETS
WHY DIVERSIFYING INTO ASIAN EQUITIES MAKES SENSE

Chief Executive Officer
SYNCICAP ASSET MANAGEMENT

The strength of equity markets in developed economies is impressive, but makes sense, as companies have held up well to the economic slowdown of recent months. That said, we believe it is now essential to diversify equity portfolios towards Asia over the next 6 to 12 months.
Developed economies have held up well in the past 18 months, particularly the US and its tech sector. Companies were mostly spared by the intense monetary tightening phase and reported solid earnings on the whole. However, things could turn more challenging in coming months. While improving slightly in Europe, growth remains rather weak worldwide and the “second derivative” of economic indicators released in recent weeks is beginning to change course in the US. Meanwhile, key rate cuts are expected to be more moderate than initially thought, based on the latest inflation indicators, which seem to point to some stubbornness.
Equity markets in developed economies have thus far stuck to positive trajectories, thanks to the powerful momentum of recent months. This favourable trend could last, but could also begin to run out of steam later in the year. We know how the markets work. They tend to ignore somewhat those changes in the economy that are almost imperceptible and to stay stuck in the “way things were”, until they are suddenly enlightened. The time has perhaps come to anticipate this process and to begin diversifying equity investments towards Asian markets. But which ones?
DIVERSIFYING EQUITY ALLOCATIONS TOWARDS ASIA
China? Yes, at current prices, there seems to be little downside risk, while there are reasonable chances of riding a significant rally, which, incidentally, seems to be what the government wants.
China is facing many challenges, both structural and cyclical, which are now well known and which are driving down general business and consumer confidence. This can be seen in consumption statistics during the Chinese lunar New Year. In volume terms, travel numbers, restaurant outings and so on were far above the pre-Covid year of 2019. But in value terms, the picture is less rosy and continues to reflect some reluctance on the part of consumers, who are keeping savings rates high in reaction to housing challenges, unemployment, and so on. Share prices are therefore depressed and valuations, low, with a 2024 P/E of less than 10x for the MSCI China, even with earnings growth projected at between 10% and 15%
The government appears to be well aware of the challenges that ordinary people are facing, and could pause the long-term ideological objectives of common prosperity and security. On the economic front, stimulus measures could be announced following the very important plenary meeting of the Chinese Communist Party, which is now being held. Likewise, a “two session” sequence that will bring almost 3000 Party delegates to Beijing in early March could be followed by announcements. An increase in the fiscal deficit and direct real-estate purchases (a sort of real-estate “quantitative easing”) have been mentioned. Meanwhile, on the equity markets, concrete technical measures to support share prices have already been taken, including purchases by state enterprises, implementing of support funds, etc.
What about the rest of Asia? Yes, but not just to ride a short-term rally. This is a far more attractive investment for the long term and looks relatively well protected from a slowdown in developed economies. Indeed, the rest of Asia consists of countries that are heavily exposed to the international and Chinese cycle , particularly Korea and Taiwan. Growth is being driven in many countries by strong consumption and investment, stimulated recently by direct international flows to India, Vietnam, etc., aiming to create manufacturing capacities that sidestep China. Valuations on the whole look rather reasonable with regards to companies’ long-term growth potential, with a 2024 P/E of almost 15 and earnings growth projected at 15% for this year.
This is the performance since the start of February by the MSCI China All Shares, which thus erased almost all its January losses. This index often experiences steep rallies.
Document completed on 06/03/2024
Carry: a strategy that consists in holding bonds in a portfolio, possibly even till maturity, in order to tap into their yields.
Core inflation: inflation ex energy and ex food.
Duration: weighted average life of a bond or bond portfolio expressed in years.
Inflation: loss of purchasing power of money which results in a general and lasting increase in prices.
Inflation breakeven: rate is the difference between the yield on a traditional bond (nominal yield) and the yield on its inflation-indexed equivalent (real yield).
Investment Grade / High Yield credit: Investment Grade bonds refer to bonds issued by borrowers that have been rated highest by the rating agencies. Their ratings vary from AAA to BBB- under the rating systems applied by Standard & Poor’s and Fitch. Speculative High Yield bonds have lower credit ratings (from BB+ to D, according to Standard & Poor’s and Fitch) than Investment Grade bonds as their issuers are in poorer financial health based on research from the rating agencies. They are therefore regarded as riskier by the rating agencies and, accordingly, offer higher yields.
PER: Price to Earnings Ratio. A stock market analysis indicator: market capitalisation divided by net income.
PMI: the Purchasing Managers Index (PMI) from Standard & Poor’s assesses the relative level of business conditions. The data is compiled from a survey of purchasing managers in the manufacturing industry. A reading above 50 indicates expansion, and below that indicates contraction. The composite PMI is a PMI index representing both the manufacturing and services sectors.
Quantitative Easing: massive purchases of debt securities by a central bank.
Spread: difference between interest rates. Credit spread is the difference in interest rate between a corporate bond and a same-dated benchmark bond that is regarded as the least risky (benchmark government bond). Sovereign spread is the difference in interest rate between a sovereign bond and a same-dated benchmark bond that is regarded as the least risky (German benchmark government bond).
Volatility: corresponds to the calculation of the amplitudes of variations in the price of a financial asset. The higher the volatility, the riskier the investment will be considered.
This promotional document contains information and quantified data that Ofi Invest Asset Management considers to be well-founded or accurate on the day on which they were produced. No guarantee is offered regarding the accuracy of information from public sources. The analyses presented are based on the assumptions and expectations of Ofi Invest Asset Management at the time of the writing of this document. It is possible that such assumptions and expectations may not be validated on the markets. They do not constitute a commitment to performance and are subject to change. This promotional document offers no assurance that the products or services presented and managed by Ofi Invest Asset Management will be suited to the investor’s financial standing, risk profile, experience or objectives, and Ofi Invest Asset Management makes no recommendation, advice, or offer to buy the financial products mentioned. Ofi Invest Asset Management may not be held liable for any damage or losses resulting from use of all or part of the items contained in this promotional document. Before investing in a mutual fund, all investors are strongly urged, without basing themselves exclusively on the information provided in this promotional document, to review their personal situation and the advantages and risks incurred, in order to determine the amount that is reasonable to invest. Photos: Shutterstock.com/Ofi Invest. FA24/0084/06032025.