PERSPECTIVES
MARKET AND ALLOCATION
Our experts monthly overview
OUR CENTRAL SCENARIO

Deputy Chief Executive Officer,
Chief Investment Officer
OFI INVEST
Central banks issued a series of announcements during the month of May and the action they took was as we had expected. The US Federal Reserve raised its rates by a quarter of a percentage point and now appears to be taking a “break” as it waits for signs that the economy is cooling as expected, i.e. with a dip in employment and then in the wage component of inflation. As we had foreseen, expectations of further interest rate cuts by the Fed have been erased for 2023 and scaled back for 2024, nudging bond yields up to levels we consider attractive at approximately 3.75% for the US 10Y maturity. The European Central Bank (ECB), meanwhile, is seen raising its rates by a further 0.25% twice more between now and the summer, also pushing German and French yields up to levels consistent with our buy targets of respectively 2.50% and 3.00% for the 10Y maturity. But we will have to keep a close eye on core inflation in the coming months as there is still a great deal of uncertainty, as shown by the surprise figures coming out of the United Kingdom.
The Investment Grade and High Yield credit markets continue to perform well and still offer attractive carry levels. Moreover, absolute yield levels in this asset class are stabilising on account of the inverse relationship between credit margins and interest rates, mechanically lowering its volatility. We would expect credit spreads to widen if the markets were to factor in an economic slowdown, but the movement would probably be offset by lower interest rates.
Whereas Europe’s stock markets held steady, those in the US were driven upwards by the technology sector with solid performances from the usual “giga-cap” stocks. We reiterate our tactically cautious position on the equity markets as much of the good news about upcoming figures already appears to have been priced in. Risk scenarios involving a far steeper-than-expected economic slowdown or, conversely, further monetary tightening by central banks should drag share prices downwards and create opportunities for investors to resume positions on the equity markets, with a preference for Europe.
OUR VIEWS AS OF 06/06/2023
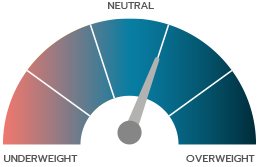

Macroeconomic statistics proved better than expected and so the markets have revised their expectations for central bank interest rates. Short-term interest rates rose in both Europe and the USA. Key interest rates are now expected to peak later than initially thought, and any cuts have now been pushed back to 2024. We are therefore now better positioned. We reiterate our recommendation to overweight bonds. The German 10Y yield is expected to hover around the 2.40%/2.50% mark over the coming months and we consider it shrewd to adopt a neutral or positive position on duration at these levels. Our views on the credit markets are also unchanged. Carry levels look attractive, especially in the High Yield segment where yields in excess of 7.5% offer a good deal of protection should the credit markets come under stress. And we have moved our inflation cursor lower after breakeven inflation expectations performed well in May.
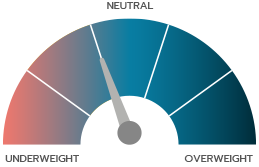

We remain cautious about the equity markets because of the uncertain economic climate. The US equity markets have implicitly priced in a moderate economic slowdown followed very quickly by support measures from the US Fed, with ultimately little impact on companies’ margins or earnings capacity. The S&P 500 is trading on a PER multiple of 19x for this year and performances are extremely concentrated, so we do not consider the US market attractive given the amount of uncertainty still out there. We reiterate our relative preference for European and Japanese equities as both these markets are trading on much more affordable multiples. But we still have a bet on the Chinese market as the prospects of an economic recovery in the country remain intact despite a few jitters in May.
The yen depreciated by about 4% against the dollar in May and remains at its lowest level against the euro since 2008 (at around 150). Japan’s Ministry of Finance intervened a few months ago to tackle the yen’s steep depreciation. It could potentially intervene again if the yen depreciates further. Moreover, Japan’s rate of inflation remains above the BoJ’s (Banque of Japan) projections and the weak yen is adding to the inflationary pressure. So a yield curve adjustment is likely to follow this year, which would involve making adjustments to the currency. We therefore remain exposed to the yen.
The euro depreciated by about 3% against the dollar in May. This was largely due to upward revisions by the markets to US monetary policy expectations.

MACROECONOMIC VIEW
GROWTH ENTIRELY FUELLED BY SERVICES

Head of Macroeconomic Research
and Strategy
OFI INVEST ASSET MANAGEMENT
The US economy is growing faster than the European economy and pleasant macroeconomic surprises are again gathering pace on the other side of the Atlantic. Consumer spending has rebounded by 21% (in real terms) since Covid began and is showing little sign of losing momentum: spending is now concentrated in the services sector, fuelled by a persistently dynamic labour market (there are still 1.8 vacancies per jobseeker) and abundant wage increases, particularly in low-wage occupations which are usually the most vulnerable to stubborn inflation. It is interesting to point out here that there are indications of this in the Beige Book(1): high inflation and the discontinuation of Covid relief benefits have continued to eat into the budgets of low-income or modest households, which has led to increased demand for welfare services (food and housing). And payment defaults on consumer loans have moved closer towards their pre-pandemic levels. Does all this indicate that consumer spending is going to fall back more significantly in the future? At this stage of the cycle, the main factor to keep an eye on is the deterioration in financial terms and conditions, especially for small and medium-sized enterprises (SMEs) which account for most of the demand surplus in the labour market and which are also exposed to regional bank risk.
Unlike the USA, the euro zone has had to deal with disappointing economic activity statistics, in particular a downward revision to Germany’s economic growth rate in the 1st quarter indicating that the country was ultimately unable to avoid a technical recession over the winter. Current data suggest that the euro zone will achieve very moderate growth in the 2nd quarter.
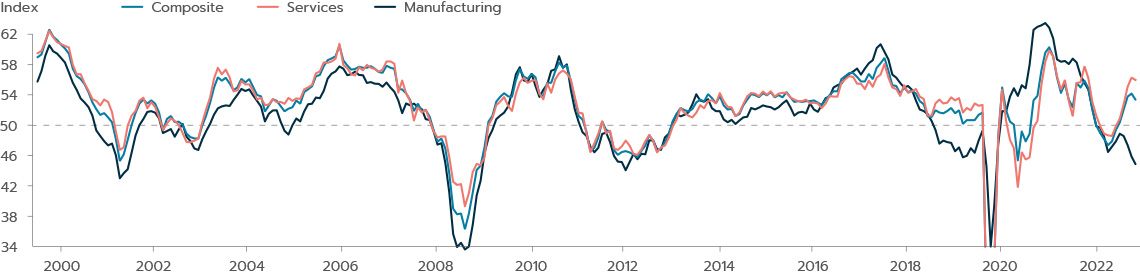
The one thing the USA and euro zone (as well as other developed countries) really have in common is that growth is exclusively services driven. Business activity surveys since the start of the year show that the industry sector has contracted whereas services have expanded considerably. This dichotomy often applies during economic slowdowns but has achieved historical dimensions in the euro zone. It would be reasonable to say that there are two reasons for the divergence: the first is that services are still enjoying a post-Covid recovery, with household spending shifting from goods to services; the second is that the industrial sector is being held back by meagre backlogs and benefiting little from China’s economic recovery which is not all that focused on durable goods. Given these circumstances, monetary policy is likely to remain geared towards tackling inflation as the disinflation process is underway, but there are still upside risks to services inflation which depends on how resilient demand remains. The latest inflation figures to have come out of the euro zone confirm that the decline in overall inflation is being driven first and foremost by energy and, secondly, by tamer inflation on food and goods prices. Inflation slowed down more sharply than expected, from 7.0% in April to 6.1% in May, and is easily expected to reach 5.0% over the course of the summer. Another positive signal as regards services inflation is that prices continued to rise in May but at a slower pace (5.0% vs 5.2% in April, year on year). However, as Christine Lagarde, President of the European Central Bank, pointed out, this is not clear evidence that underlying inflation has peaked, especially given that workers still have considerable negotiating clout and wages are in the process of catching up with inflation (the euro zone’s negotiated wages index calculated by the European Central Bank (ECB) reached a record 4.3% in the 1st quarter of 2023). This is why we do not expect the prevalent view within the ECB’s Governing Council to change at all, and we see two further 25-basis point increases in June and July, with a deposit rate at 3.75%.
The US Federal Reserve (Fed) said at its latest meeting that it expected to pause its monetary tightening in June. This is also our baseline scenario, but it is likely to be a hawkish pause.
The minutes from this meeting showed that opinions vary widely within the Board of Governors, probably even more so following the pleasant macroeconomic surprises that emerged over the month of May. This could encourage the Fed to raise its key interest rates one last time this summer, as the markets expect it to.
INTEREST RATES
HAVE YIELDS FOUND A NEW EQUILIBRIUM?

Co-CIO, Mutual Funds
OFI INVEST ASSET MANAGEMENT
The German 10Y yield is currently hovering around the 2.30% mark, which is close to its end-April level, and has stayed with the 2.20%-2.50% corridor for more than two months now. This could suggest that the European bond markets have found a new equilibrium. Whereas the Bund seems to have found its place in this new equilibrium, this is not the case for short-term interest rates or other countries such as the USA. The US 10Y yield rose from 3.42% at end-April to 3.69% at end-May.
When the Fed and ECB last raised their interest rates in early May, the bond markets were already factoring in an end to the monetary tightening cycle but also a series of rapid interest rate cuts thereafter, particularly in the USA. The markets expected interest rates to be lowered primarily because of the risks to US economic growth. But recent economic statistics in both the USA and Europe - with a PMIs services index we believe to be robust and high inflation figures in the UK - have made further interest rate hikes more likely, especially by the BoE (Bank of England). More significantly, expectations of interest rate cuts have partly evaporated. As a result, short-term interest rates have stretched more than longterm interest rates, prompting yield curves to become more inverted. For the record, inverted yield curves generally point to a recession. Can interest rates rise any further? We doubt it.
We already pointed out last month that the ECB was set to complete its monetary tightening cycle probably following another two interest rate hikes, after which we expect it to take a long break. Similarly, expectations of interest rate cuts in the USA in 2023 seemed overdone. The markets have therefore become more aligned with our forecasts in recent weeks, and we think that most of the monetary tightening is now over. It is primarily for this reason that we are overweight bonds in general. Although we do not expect interest rates to decrease at all significantly in the coming months, sovereign bonds seem attractive from a carry perspective. Moreover, sovereign bonds will be all the more useful to hold as part of a balanced allocation strategy because of the lack of visibility in the second half of the year and the risks hanging over the economy.
EUROPE’S BOND MARKET HAS EVERYTHING GOING FOR IT
From a public or private issuer’s perspective, higher issue yields are rarely synonymous with good news. But what matters most is to be able to place one’s debt with investors, and issues have gone well so far. This is largely thanks to attractive issue levels and still solid corporate earnings.
But why are yield levels on the credit markets so attractive? First of all, yields on the credit markets have risen as central banks have hiked their key interest rates. Secondly, following a number of volatile episodes in 2022, credit spreads have now settled at levels that are above the average for the past 10 years. The fact that the ECB is approaching the end of its monetary tightening cycle is also reassuring as it rules out the risk of monetary policy going off course, even though the central bank is downsizing its asset purchases.
With credit levels in the region of 4.25% in the Investment Grade segment, above 7.5% in the High Yield segment and at 3.5% in the money markets, the bond market is once again looking like more than just an alternative to the equity markets. Europe’s credit market has plenty going for it, including lower volatility, positive returns year-todate and a carry strategy that will protect investors should spreads widen.
The Bank of England’s key interest rate since its 0.25% hike on 11th May 2023. The rate could rise to 5.5% by year-end according to market expectations.
| BOND INDICES WITH COUPONS REINVESTED | MAY 2023 | YTD |
|---|---|---|
| JPM Emu | 0.34% | 2.66% |
| Bloomberg Barclays Euro Aggregate Corp | 0.17% | 2.64% |
| Bloomberg Barclays Pan European High Yield en euro | 0.89% | 4.32% |
Past performances are not a reliable indicator of future performances.
EQUITIES
CHINESE GROWTH: WILL IT PREVENT THE EQUITY MARKETS FROM PERFORMING WELL?

Co-CIO, Mutual Funds
OFI INVEST ASSET MANAGEMENT
This is clearly the big question facing operators at this stage of the cycle, as reflected in the sectoral and regional performances observed during the month of May. And yet it was a well-established scenario, one that had been addressed by a large number of strategists in recent months. China’s reopening was to “inject” the entire planet with an economic growth surplus and benefit companies exposed to Chinese consumer spending. The financial markets had even prepared for the occasion, turbocharging luxury, leisure and hotel stocks and making them among the top performers year-todate, especially in Europe and Asia, two regions that are traditionally highly exposed to Chinese consumer spending. The latest statistics released appear to paint a different picture to that initially expected. Recently published economic and financial data include gloomy leading indicators and point to a more moderate recovery. Meanwhile, trade relations between China and the USA have become much more tense, adding to the risks hanging over the region’s economic upturn.
AN IMPACT ON SECTOR PERFORMANCES
A close look at sector performances in May shows that they fully reflect China’s slackening economic momentum. Here in Europe, luxury and cosmetics stocks (LVMH*, L’Oréal*, etc.) have fallen more steeply than the market, even though their yearto- date performances are still more than satisfactory. In Japan, department stores (Takashimaya*, etc.), rail and air transportation companies (East Japan Railway*, etc.) and non-food retailers (ABC-MART INC*) also stalled in May, contrasting with their performances of recent months. In the USA, meanwhile, groups that depend heavily on China to meet their official growth targets (YUM Brands*, Starbucks*, etc.) also performed poorly on the markets, despite beating expectations with their earnings figures.
Not to worry! China may be a disappointment, but all bets are now on Artificial Intelligence (AI). The quarterly figures released by Nvidia* in the USA and, more importantly, the upward revisions to its business prospects (fuelled by increased investments in generative AI) have once again energised the entire AI universe. This means that the S&P 500 index’s performance was concentrated even more heavily on just a few companies in May. The index’s performance would have even been in negative territory if all its components were weighted equally.
VERY NARROW TRADING RANGES
Notwithstanding the volatility created by the collapse of several US regional banks, the equity markets stayed within very narrow trading ranges in May. In concrete terms, the markets are back at the levels they stood at in late January when we decided to slightly downgrade this asset class to below neutral. We remain cautious, although by no means do we expect the markets to collapse. The US and European markets are trading on PER multiples of respectively 19 and 13, so there is some leeway but very little. Such multiples are justifiable if long-term interest rates remain exactly where they are and if, concurrently, there are no severe downward revisions to global economic growth as this would impact on corporate earnings. Valuation multiples would no longer be justifiable if the bond markets were to come under considerable pressure or if the economy were to contract sharply.
GEOGRAPHIC DIVERGENCES
We are still slightly underweight US stocks. The market’s multiples remain stubbornly high and index performances since the start of the year have been exceedingly concentrated on a handful of firms, making their gains more fragile than elsewhere. We prefer Europe and Japan, where multiples are much lower and yet earnings growth prospects are practically identical. Last of all, we remain overweight on the Chinese market despite its poor performances.
NVIDIA’s* market capitalisation in May after having gained 160% since the start of the year.
| EQUITY INDICES WITH NET DIVIDENDS REINVESTED, IN LOCAL CURRENCIES | MAY 2023 | YTD |
|---|---|---|
| CAC 40 | -4.21% | 11.68% |
| EuroStoxx | -2.51% | 10.59% |
| S&P 500 in dollars | 0.38% | 9.41% |
| MSCI AC World en dollars | -1.07% | 7.68% |
Past performances are not a reliable indicator of future performances.
EMERGING MARKETS
HAS CHINA REALLY TAKEN OFF?

Chief Executive Officer
SYNCICAP ASSET MANAGEMENT

China’s decision to suddenly scrap its zero- Covid policy came as a surprising and promising piece of news. The stock market welcomed the decision, with the MSCI China All Shares index soaring by more than 40% up to mid-January. The trend has reversed since then, with the index shedding around 15%. How best to analyse the situation?
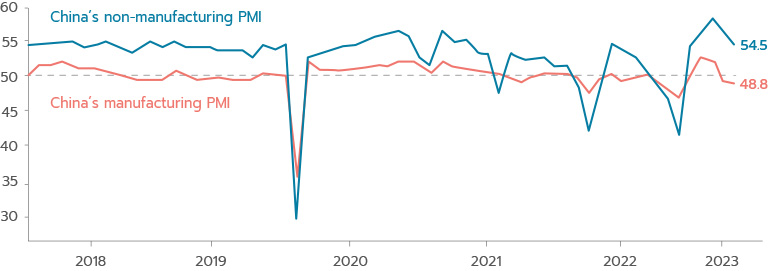
GDP increased by 4.5% year-on-year in the 1st quarter and the country registered very good mobility indicators during Golden Week. But this initial momentum has abated. The manufacturing PMI fell for the second month in a row to 48.8, its lowest level since December 2022. The services and construction index, meanwhile, remained above the 50.0 threshold (at 54.5) but was also below the previous month’s level (56.4). Moreover, foreign direct investment shrank by 3.3% during the first four months of the year and youth employment rose further to almost 20%, all against a very tense international backdrop.
Overall confidence seems to be lacking and the government has no clear economic stimulus plan at a time when the three main factors that have driven China’s economy in the past 15 years are showing signs of running out of steam:
- Property. The safeguards brought in by the Chinese authorities have enabled the market to stabilise, but the sector will no longer be a growth driver. Property investments are petering out and have dropped by 6.2% since the start of 2023. There are two other factors that are going to take a toll: the government has decided to curb property speculation in order to make housing more accessible; and the number of inhabitants in China’s four largest cities contracted in 2022 due to population decline.
- Exports. Export activity accounts for approximately 20% of China’s GDP, which means that the country cannot shut itself off from the rest of the world. But there are two obstacles: the USA is waging a trade war based on tariffs and embargoes; and Europe and the USA are experiencing a slowdown.
- Investment in infrastructure. Following the crisis of 2008, the government boosted activity by introducing massive infrastructure programmes. This is no longer the case as there is less need for infrastructure but above all there are financial constraints. This year’s budget deficit has been capped at 3% of GDP as cumulative public and private debt has grown to enormous proportions, now on a similar scale to the West at around 280% of GDP. The difference with Western countries is that this debt is held to a very large extent domestically and the country has foreign exchange reserves (amounting to some USD3,200bn) and a trade surplus. So the recovery will be assisted primarily by monetary measures. The reserve requirement ratio for banks has been lowered several times, from 11.25% in early 2019 to 7.6% at present. The medium-term key interest rate has also fallen to 2.75%.
The government’s 5% growth target therefore looks less certain. The markets will watch the twice-yearly economics working meeting of the Politburo closely. The meeting is being brought forward to June this year. It could decide to lower corporate taxes on high-tech companies or introduce targeted measures in favour of households since the government needs to focus on domestic consumption as its main economic growth driver. There is potential here as domestic consumption still accounts for only a limited share of the economy, at around 38% compared with about 70% in the USA. The Bloombergcompiled consensus of economic forecasts has revised its economic growth projection for 2023 downwards to 5.5%.
The country is likely to promote the following growth sectors: technology, as China is keen to maintain the degree of leadership required in the arms industry (as is the case in the USA); green energy, with China working to attain a certain level of energy independence (in keeping with its aim to achieve carbon neutrality by 2060); leisure; healthcare (the silver economy, catering to an ageing population); online gaming; and cosmetics. Following the recent downturn, stock valuations have fallen across the market: it is now trading on a 2023 PER of 11x, with earnings growth forecasts at between 15% and 20%.
In short, domestic and international firms alike seem to lack a frame of reference in a China where the political situation has evolved. International investors are “giving up” on Chinese stocks, even though they enjoyed a favourable consensus at the start of the year and appear to be trading at a discount.
China’s economic growth rate, above the government’s 5% target.
Source: the latest economists’ consensus compiled by Bloomberg.
Document completed on 06/06/2023
Breakeven inflation: it is the difference between the yield on a traditional bond (nominal yield) and the yield on its inflation-indexed equivalent (real yield).
Carry: a strategy that consists in holding bonds in a portfolio, possibly even till maturity, in order to tap into their yields.
Duration: the weighted average life of a bond or bond portfolio expressed in years.
Golden Week: series of four public holidays in Japan condensed into seven days.
Hawkish (forceful or aggressive): central banks generally apply a hawkish monetary policy to tackle inflation.
Inflation: the loss of a currency’s purchasing power, translating into a widespread and lasting increase in prices. Core inflation refers to inflation excluding energy and food.
Investment Grade / High Yield credit: Investment Grade bonds refer to bonds issued by borrowers that have been rated highest by the rating agencies. Their ratings vary from AAA to BBB- under the rating systems applied by Standard & Poor’s and Fitch. Speculative High Yield bonds have lower credit ratings (from BB+ to D, according to Standard & Poor’s and Fitch) than Investment Grade bonds as their issuers are in poorer financial health based on research from the rating agencies. They are therefore regarded as riskier by the rating agencies and, accordingly, offer higher yields.
Manufacturing PMI: index measuring the business activity of Purchasing Managers in the industrial sector.
PER: Price to Earnings Ratio. A stock market analysis indicator consisting in dividing price by earnings.
Spread: difference between interest rates. Credit spread is the difference in interest rate between a corporate bond and a same-dated benchmark bond that is regarded as the least risky (benchmark government bond). Sovereign spread is the difference in interest rate between a sovereign bond and a same-dated benchmark bond that is regarded as the least risky (German benchmark government bond).
Volatility: a measure of the amplitudes of price variations of a financial asset. The higher the volatility, the riskier the investment is considered to be.
This promotional document contains information and quantified data that Ofi Invest Asset Management considers to be well-founded or accurate on the day on which they were produced. No guarantee is offered regarding the accuracy of information from public sources. The analyses presented are based on the assumptions and expectations of Ofi Invest Asset Management at the time of the writing of this document. It is possible that such assumptions and expectations may not be validated on the markets. They do not constitute a commitment to performance and are subject to change. This promotional document offers no assurance that the products or services presented and managed by Ofi Invest Asset Management will be suited to the investor’s financial standing, risk profile, experience or objectives, and Ofi Invest Asset Management makes no recommendation, advice, or offer to buy the financial products mentioned. Ofi Invest Asset Management may not be held liable for any damage or losses resulting from use of all or part of the items contained in this promotional document. Before investing in a mutual fund, all investors are strongly urged, without basing themselves exclusively on the information provided in this promotional document, to review their personal situation and the advantages and risks incurred, in order to determine the amount that is reasonable to invest. Photos: Shutterstock.com/Ofi Invest. FA23/0115/06122023