PERSPECTIVES
MARKET AND ALLOCATION
Our experts monthly overview
OUR CENTRAL SCENARIO

Deputy Chief Executive Officer,
Chief Investment Officer
OFI INVEST
Disinflation expectations and central bank timing continued to drive the markets in March, with a widening gap between the United States and the euro zone. In the US, activity data continue to point to a robust economy, and that is propping up inflation commensurately, as seen in early-year figures. We nonetheless believe, like the US Federal Reserve, that these effects are transitory and that Jerome Powell will make his first rate cut by this summer, with a total of three by yearend. In Europe, the latest inflation figures reassuringly came in below expectations and have given the ECB full leeway for also pulling the trigger on its first rate cut by this summer and for adjusting its short-term rates by the same order of magnitude as the Fed.
Long bond yields are likely to continue hovering around their current levels, which we feel argue for a modest amount of portfolio duration. The carry trade and the likely slight receding after the first rate cuts look attractive, assuming a steepening in yield curves. Keep in mind that the return to the spotlight of budget overruns in France and Italy has caused a slight widening in sovereign spreads, but these are likely to remain under control, thanks to corrective measures expected from governments.
The credit market continues to fare well on the whole, although some idiosyncratic events continue, including the case of Altice* France, which is using new bankruptcy law provisions to bail in its creditors, something that would change the nature of relations between lenders and borrowers. It will be worth keeping an eye on this story in the coming months.
The equity markets continue to move up, thus raising shares priceearnings ratios. All rallies come to an end, but it is hard to say exactly when and, in the meantime, to resist the market’s power. We reiterate our neutral stance but recommend setting up convexity positions in equity portfolios for two reasons: 1/ to lock in some of the year-to-date gains; and 2/ to remain exposed to a market that could continue to post gains in the short term, pending central bank rate cuts. This could be a good time to recall the old market adage “Buy the rumour, sell the fact”!
OUR VIEWS AS OF 04/04/2024


Inflation is likely to gradually revert to the central banks’ 2% target. The markets are now broadly pricing in a homogenous shift of about three to four rate cuts in 2024 by the three major central banks: the Fed (US), the BoE (UK) and the ECB (euro zone). This is in line with our expectations early this year. Bond market volatility has receded, and there appears to be less upward or downward potential for the 10-year German yield in the short term. A phase of steepening could nonetheless begin with the upcoming key rate cuts. We therefore continue to slightly overweight duration in the run-up to the rate-cut cycle and will wait for a little more volatility before changing our stance in one direction or another. In conclusion, we remain bullish on euro bond markets in general for the carry trade, while slightly raising our view on investment grade corporate bonds vs. other asset classes.


The equity markets just keep roaring ahead. Long bond yields are no longer falling, and 2024 earnings forecasts have not been upgraded. The inevitable consequence of this is a rise in price-earnings ratios. But how far and for how long? That’s very hard to say, and although we can’t regard equity valuations as “attractive”, especially in the US, it is hard to ignore the markets’ overpowering strength, driven by a wave of liquidity. Geographically, we have no strong convictions, with the exception of emerging markets ex China, which we are overweighting. The eternal debate goes on between the euro zone and the US. The euro zone is still priced lower than the US, but the US hosts the uncontested champions of AI, without which the S&P 500 would not have risen so high. Pending the release of quarterly earnings, we prefer sticking to a neutral stance on the asset class, but in order to continue riding the equity market rally while hedging partially against an alternative scenario, a convexity-based strategy seems to make sense – either by buying put options on a portion of the portfolios, or by using convertible bons.
The euro ended March flat vs. the dollar. Although disinflation continues in the US and economic activity is gradually rebounding in the euro zone, we don’t expect the dollar rally to continue. Despite the end of negative rates and of Japan’s yield-curvecontrol plan, the yen has not rallied. We remain slightly constructive on the yen, based on our assumption that it is still undervalued. The ECB’s monetary easing could drive the yen upward. A further depreciation in the yen could trigger an official intervention on the current markets.

MACROECONOMIC VIEW
DISINFLATION IS STILL THE MOST LIKELY SCENARIO

Head of Macroeconomic Research
and Strategy
OFI INVEST ASSET MANAGEMENT
The equity markets hit new highs in March, driven, among other things, by central bank language, in particular from the Fed. It is now just a matter of months before the 2024 monetary easing phase begins. One of the biggest dangers for risky assets would therefore be if the Fed were to put off plans to lower its key rates, keeping them at their current levels until yearend.
Inflation data for January and February were surprisingly high, but the US Federal Reserve regards that as background noise, rather than a reversal of trend in inflation. Disinflation, which should henceforth be very gradual, is also our baseline scenario.. The reason for this is sticky inflation in services, one of inflation’s more rigid components. Keep an eye on this, as it is high and gathered momentum early this year.
THERE ARE SEVERAL REASONS WE ARE STICKING TO OUR DISINFLATION SCENARIO
First, inflation in rents is likely to continue to recede in the coming months, as rental housing stock adjusts to the inflation of housing units currently available for rent, which is far more moderate. Keep in mind that the Fed’s benchmark indicator, the personal expenditure deflator, is already below 3%, as it weights real estate significantly lower than the consumer price index.
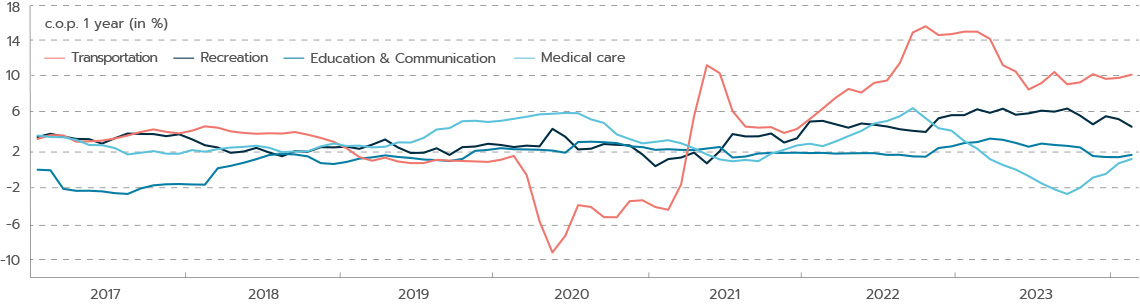
Second, components of services inflation ex housing are heterogenous (see chart) and, in our view, most of the reacceleration in prices is due not to the strength of the US economy (and, hence, to heightened demand), but, rather, to idiosyncratic factors that are likely to fade (such as auto repair and insurance costs, which are included in transport services). Meanwhile, inflation components that are more demand-driven, such as entertainment, are already moderating. And, lastly, companies’ cost pressures are easing. On the one hand, the gradual normalisation of the labour market seen, for example, in the moderation of the resignation rate, is historically a harbinger of lower pressures on wage growth and, on the other hand, strong productivity gains are helping to mitigate companies’ cost pressures and, hence, their prices.
BUT RISKS ARE LOOMING IN THE US...
If this scenario comes to pass, the Fed is likely to begin lowering its rates in June. However, the balance of risks remains asymmetric, and inflation could end up stickier than expected, due to stubborn inflation in services and/or a reacceleration of inflation in goods. If inflation once again surprises on the upside, the Fed may put off its first rate cut until it is more confident that inflation is at 2% on a sustained basis. This scenario could stoke uncertainty on the markets.
…WHICH ARE LESS PRONOUNCED IN THE EURO ZONE
There appears to be less of a risk that the ECB will postpone its first rate cut than in the US. While reiterating its data-dependence, the ECB is preparing the ground for a first rate cut in June, pointing out that “we will know a little more in April, but we will know a lot more in June.” Between the lines, that means that at its June meeting, the ECB will have more data on first quarter 2024 wage negotiations. We believe that by June the ECB will be able to confirm that the peak of the wage catching-up phase and, hence, the peak of companies’ cost pressures are past. Flash inflation figures for March nonetheless confirm the need to wait for these data, as the fall in core inflation in March below 3% year-on-year for the first time February 2022 was due solely to the further disinflation in consumer food and manufacturing prices, while inflation in services has held at 4.0% since November.
After the June meeting, macroeconomic conditions are likely to argue for the gradual continuation of monetary easing, in order to back a tentative recovery in the euro zone, which is currently being held back by weakness in Germany.
INTEREST RATES
STEADIER AND STEADIER

Co-CIO, Mutual Funds
OFI INVEST ASSET MANAGEMENT
Inflation and growth are returning to normal; interest rates are stabilising; credit spreads continue to narrow despite idiosyncratic risks; and there is a consensus forecast on key rate cuts. Central bank meetings did indeed highlight March by anchoring the market expectations more fully on the upcoming direction of monetary policies.
MARKET EXPECTATIONS ARE WELL ANCHORED
While the Bank of Japan (at last!) brought the negative-rate era and its yield-curve control policy to an end, the Swiss National Bank surprisingly cut its key rate to 1.5%. The SNB got the jump on the European Central Bank, which confirmed the possibility of an initial rate cut in June, and the Bank of England and the US Federal Reserve, which are laying the ground for two rate cuts this summer.
This first adjustment, which is already priced in by the market is expected to be followed by two or three additional ones in 2024 and to end in 2025, once key rates have reached a theoretical neutral level, i.e., that is neither accommodative, nor restrictive. This would therefore be an almost ideal scenario in which inflation returns to the target.
10-YEAR SOVEREIGN DEBT LOOK FAIRLY PRICED
Bond market volatility has receded markedly, with the MOVE index (see below) falling from 126 to 86 on the quarter. The MOVE is based on US interest rates, with the T-Note having barely budged this month, slipping from 4.25% to 4.20%. Meanwhile, the Bund fell from 2.41% to 2.30%, showing that the markets agree with the ECB’s economic forecasts of a yearend recovery. Against this backdrop, short-term rates remain higher than long-term ones, an unusual configuration that has lasted for about a year and a half. We expect this anomaly to correct itself, once key rates have fallen. We therefore remain slightly bullish on duration with a preference for strategies on curve-steepening strategies, which could take the form of a cut in short-term rates and possibly a rise in long-term rates, a rise that would nonetheless remain moderate.
The 10-year spread between euro zone countries is another thing to keep an eye on. The spread between Germany and Italy narrowed to 1.21% in mid-March, a quite tight level that had not been seen since 2021. Technical factors then widened this spread, as well as the spread vs. the OAT (the benchmark French government bond).
French bond spreads returned to their levels of the start of the year. To estimate the fair level of spreads, keep an eye in the coming months on trends in fiscal policies, as well as rating agency research.
INVESTMENT GRADE CREDIT IS BACK
The credit market had another strong month, with investment grade outperforming high yield. Investment grade was driven by shifts in interest rates and carry, particularly in subordinated debts. Keep in mind that the market was driven especially by idiosyncratic risks during the month. The narrowing of high yield spreads stopped, especially with the case of Altice France*, which announced it would not honour its deleveraging commitments – a brutal attempt to bail in creditors. As a result, the lowest-rated high yield paper underperformed, with CCC issues giving up a large portion of their year-to-date gains. This reinforced our stance in favour of BB issuers and our interest in goodquality corporate issuers. Against this backdrop, risks of wider spreads are probably in the short term. However, in the medium term, risks appear to be downward, as many issuers were able to refinance this month, thus pushing back default risks to 2025 or 2026.
This is where the MOVE (ICE BofA MOVE index), which measures volatility of US bond yields, ended in March, a more than two-year low. The most recent high was 198.7, on 15 March 2023, during the US regional bank crisis.
| BOND INDICES WITH COUPONS REINVESTED | MARCH 2024 | YTD |
|---|---|---|
| JPM Emu | 1.01% | - 0.62% |
| Bloomberg Barclays Euro Aggregate Corp | 1.22% | 0.47% |
| Bloomberg Barclays Pan European High Yield in euro | 0.41% | 1.81% |
EQUITIES
HIGHER AND HIGHER

Co-CIO, Mutual Funds
OFI INVEST ASSET MANAGEMENT
Nothing seems to be holding back the rally on international equity markets. In March, the MSCI World once again gained more than 3%. The Goldilocks scenario (i.e., a moderate slowdown in economic activity, along with lower inflation) has become the “new normal”. We hardly dared believe it just a few months ago, and now it is the working assumption of a large number of strategists worldwide. And recent economic releases continue to reflect this ideal environment.
We had theorised that, to go higher, the markets would have to find new champions. In the United States, the S&P 500 is up by a massive 25% over the past five months, driven mostly by the artificial intelligence (AI) thematic. For some perspective, its 11,000 billion dollar gains in market cap compares to a US economy that is worth “only” 27,000 billion dollars.
OTHER THAN AI, WILL ‘TRADITIONAL SECTORS’ BACK THE US MARKET?
While AI beneficiaries continue to drive US earnings growth in the first part of the year, “traditional” sectors will have to take over in the second half of the year to reach the 11% growth expected for the full year.
For the moment, household consumption continues to fare well, with wealth effects and wages remaining strong. However, business investment may hold some surprises. While expected to expand in 2024, recovering from a rather glum year in 2023, capex may once again focus on AI spending. At least, that’s what seems to be the cause of the recent disappointing guidance by S4* and Accenture*. Trends in the second-half earnings outlook will therefore be crucial to US market trends.
EUROPEAN MARKETS ARE BETTING ON A REBOUND IN GROWTH
In Europe, the markets are hoping for an economic recovery, as seen in the recent rotation into more cyclical and more value-oriented sectors, e.g., March performances in banking, chemicals and basic materials. And it’s true that leading indicators seem to be pointing the way to a recovery.
The Citigroup economic surprises indicator illustrates this and could be pointing to a manufacturing recovery in the coming months. However, and in contrast to trends of previous quarters, quality stocks appear to be riding more negative momentum. In March, it was Kering’s* turn to drive the luxury sector downward, after Gucci’s* Asian numbers fell far short of forecasts.
IN ASIA, JAPAN IS LEADING THE DANSE
In Asia, once again the surprise came from Japan. Paralysed by labour shortages, major Japanese multinationals agreed to wage hikes of 5% to 10%, something not seen in the past 25 years. Although Japanese midcap companies will obviously not follow suit, the Japanese government nonetheless is hoping for wage hikes higher than 2.5% on a nationwide basis, in order to boost household consumption, and, incidentally, allow the Topix to remain one of the top performing indices in 2024! The Bank of Japan has just taken note of these good economic figures in, at last, exiting its negative-rate policy.
First-quarter reporting season is coming up. It will tell us a little more about companies’ ability to preserve their margins.
That’s how much US equity and bond markets have increased in value since the Fed’s November meeting, equivalent to half of US GDP!
| EQUITY INDICES WITH NET DIVIDENDS REINVESTED, IN LOCAL CURRENCIES | MARCH 2024 | YTD |
|---|---|---|
| CAC 40 | 3,59% | 8,98% |
| EuroStoxx | 4,52% | 10,03% |
| S&P 500 in dollars | 3,18% | 10,44% |
| MSCI AC World in dollars | 3,09% | 8,14% |
EMERGING MARKETS
ASIA EX CHINA EQUITIES: THREE EARLY-STAGE GROWTH THEMES

Chief Executive Officer
SYNCICAP ASSET MANAGEMENT

Almost 2 billion people live in Asia ex China, in highly developed countries such as Korea and Taiwan, and others that are still in the development phase, such as India. Beyond this purely geographical aspect, Asia ex China is, above all, well placed to benefit from the advent of three structural growth themes.
Asia ex China is the fourth-largest weighting in the international equity index, with almost 5% of the MSCI World All Countries. India accounts for 34%, Taiwan 32% and Korea 23.8%, followed by countries with still low weightings in the indices, such as Indonesia, Thailand and other, highly promising ones, such as Vietnam. This investment universe of almost 430 stocks includes countries at very different stages of development, something that provides lots of choice. But, beyond these mere facts, Asia ex China equities offers an opportunity for exposure to three structural growth themes that are still at very early stages of development:
1 - The theme of artificial intelligence (AI). It seems rather clear that AI is only getting started. Many studies have found that AI will allow those countries that are the furthest along in this field to boost their potential growth and productivity significantly. In short, there are big stakes in AI. According to a Goldman Sachs study, annual investments in AI are likely to rise sharply in the coming years amount to almost 200 billion dollars in 2025. In the longer term, AI-related investments could reach 2.5% to 4.0% of GDP in the US and 1.5% to 2.5% in the other largest countries. Asia has a few companies that are well placed in this sector, including two global leaders that are must-haves.
One of these is TSMC*, the Taiwanese semiconductor maker, which enjoys a big lead in advanced nodes, latest-generation connectors, with 80% to 90% market share. TSMC supplies leading companies such as Nvidia* and AMD*. TSMC still looks reasonably priced (with a 2024e P/E of 23x), due to these prospects. The other is the Korean company HYNIX*, which specialises in high-bandwidth memories), used, among other things, in AI graphics. It currently has market share of about 50%. More generally, the technology sector, broadly defined, accounts for almost 40% of the investment universe of this zone.
2 - The theme of the boom in domestic consumption with the emergence of a middle class in highly populated countries like India, Indonesia and Vietnam. This is a classic trend in developing countries. Higher income levels raise living standards considerably for a portion of the population, giving them access to heretofore inaccessible consumer goods and leisure. This is good news for many companies that are managing to establish franchises or brands, thus becoming leaders, such as Mapi* in Indonesia, Trent* and Titan* in India, and PNJ* in Vietnam.
3 - The “China workaround” theme, called the “China +1 strategy”. China has become controversial in recent years. The Covid crisis brought to light Western economies’ overdependence on China, the “world’s factory”. Meanwhile its more top-down governance, with, moreover a conciliatory attitude towards Russia, has taken Western countries aback. The US has sanctioned many Chinese companies. All this is pushing both Western and Chinese companies to invest in the rest of Asia. Direct investment is therefore flowing into neighbouring countries, such as India, Vietnam and Indonesia. This is very good news for infrastructure companies such as L&T*, ABB India* and KBC* in Vietnam.
In short, these three growth themes are at the start of the cycle, and valuations on the whole are rather reasonable, with 2024e P/Es of almost 15x and earnings growth forecast at about 15% this year.
The number of people who will emerge from poverty and into the middle class in India over the next 20 years.
Document completed on 04/04/2024
Carry: a strategy that consists in holding bonds in a portfolio, possibly even till maturity, in order to tap into their yields.
Core inflation: inflation ex energy and ex food.
Duration: weighted average life of a bond or bond portfolio expressed in years.
Inflation: loss of purchasing power of money which results in a general and lasting increase in prices.
Inflation breakeven: rate is the difference between the yield on a traditional bond (nominal yield) and the yield on its inflation-indexed equivalent (real yield).
Investment Grade / High Yield credit: Investment Grade bonds refer to bonds issued by borrowers that have been rated highest by the rating agencies. Their ratings vary from AAA to BBB- under the rating systems applied by Standard & Poor’s and Fitch. Speculative High Yield bonds have lower credit ratings (from BB+ to D, according to Standard & Poor’s and Fitch) than Investment Grade bonds as their issuers are in poorer financial health based on research from the rating agencies. They are therefore regarded as riskier by the rating agencies and, accordingly, offer higher yields.
Spread: difference between interest rates. Credit spread is the difference in interest rate between a corporate bond and a same-dated benchmark bond that is regarded as the least risky (benchmark government bond). Sovereign spread is the difference in interest rate between a sovereign bond and a same-dated benchmark bond that is regarded as the least risky (German benchmark government bond).
Volatility: corresponds to the calculation of the amplitudes of variations in the price of a financial asset. The higher the volatility, the riskier the investment will be considered.
This promotional document contains information and quantified data that Ofi Invest Asset Management considers to be well-founded or accurate on the day on which they were produced. No guarantee is offered regarding the accuracy of information from public sources. The analyses presented are based on the assumptions and expectations of Ofi Invest Asset Management at the time of the writing of this document. It is possible that such assumptions and expectations may not be validated on the markets. They do not constitute a commitment to performance and are subject to change. This promotional document offers no assurance that the products or services presented and managed by Ofi Invest Asset Management will be suited to the investor’s financial standing, risk profile, experience or objectives, and Ofi Invest Asset Management makes no recommendation, advice, or offer to buy the financial products mentioned. Ofi Invest Asset Management may not be held liable for any damage or losses resulting from use of all or part of the items contained in this promotional document. Before investing in a mutual fund, all investors are strongly urged, without basing themselves exclusively on the information provided in this promotional document, to review their personal situation and the advantages and risks incurred, in order to determine the amount that is reasonable to invest. Photos: Shutterstock.com/Ofi Invest. FA24/0113/04042025.